In the age of data-driven decision-making, having immediate access to relevant and actionable business insights is essential. Performance dashboards have become a critical tool for organizations aiming to monitor progress, improve productivity, and make informed strategic decisions. These dashboards provide a visual representation of key performance indicators (KPIs) and metrics, enabling businesses to respond swiftly to changing conditions.
This article explains why performance dashboards are essential for every business and how to implement them effectively.
What is a Performance Dashboard?
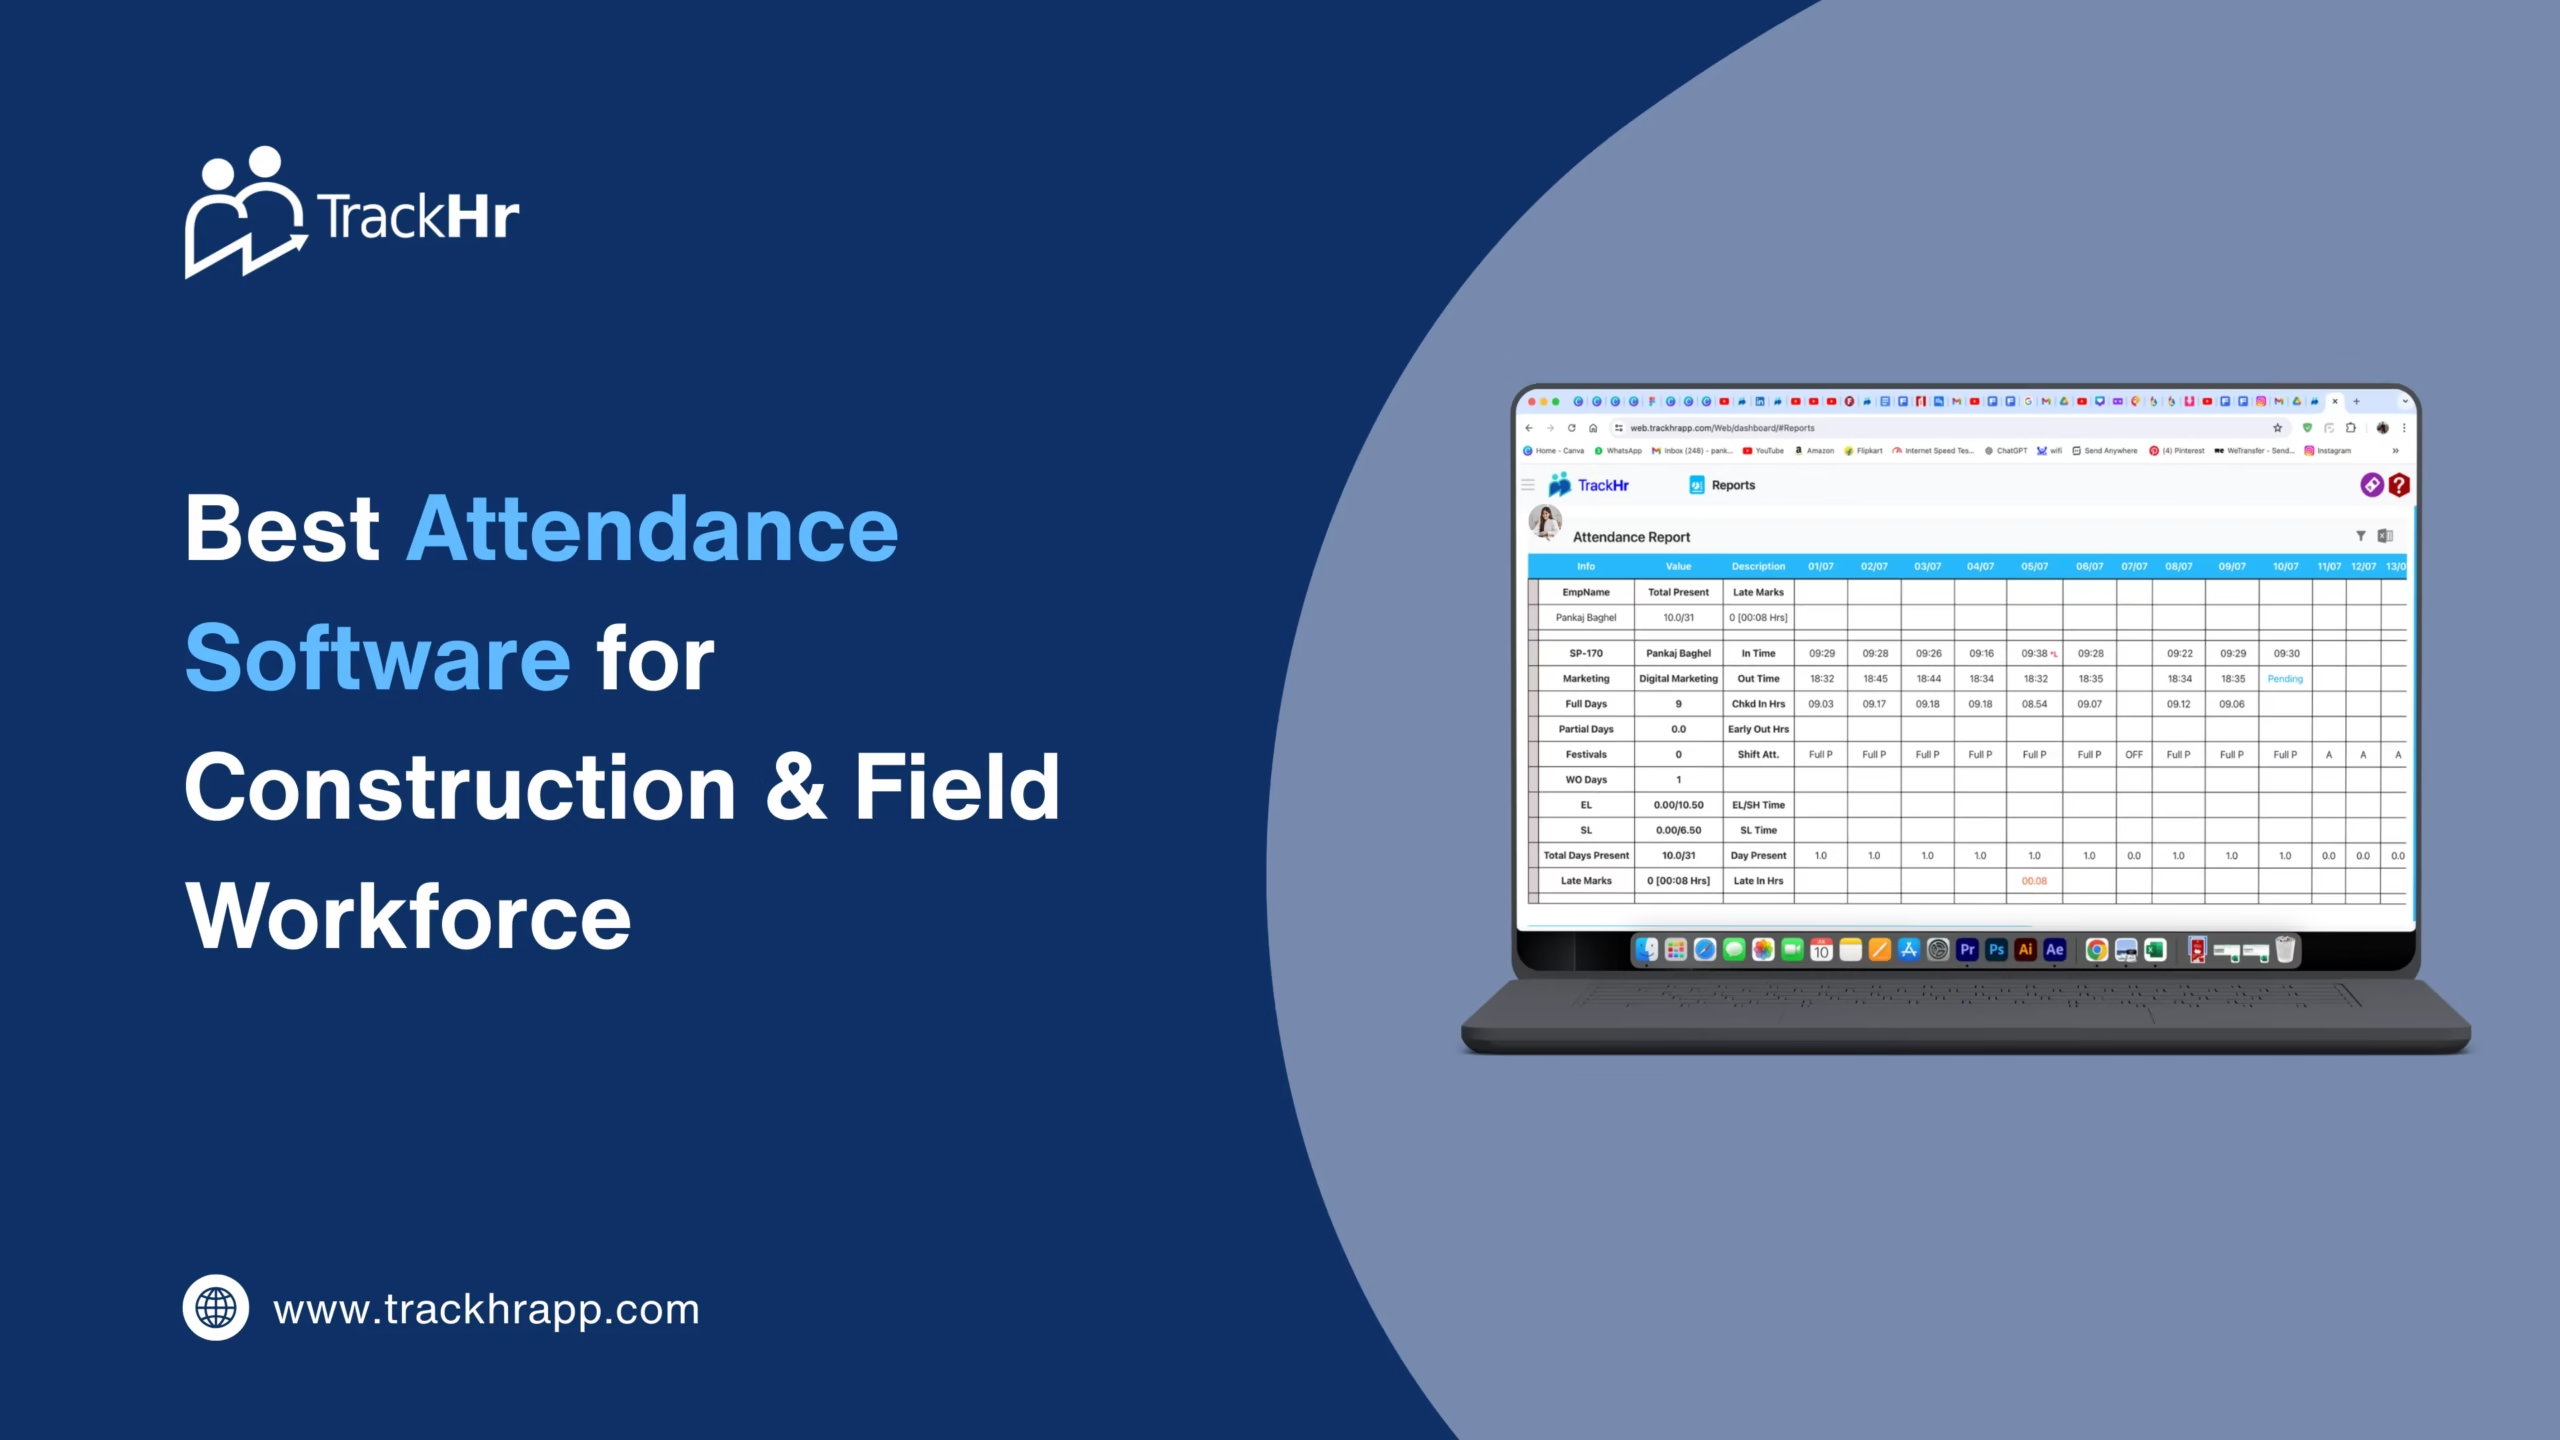
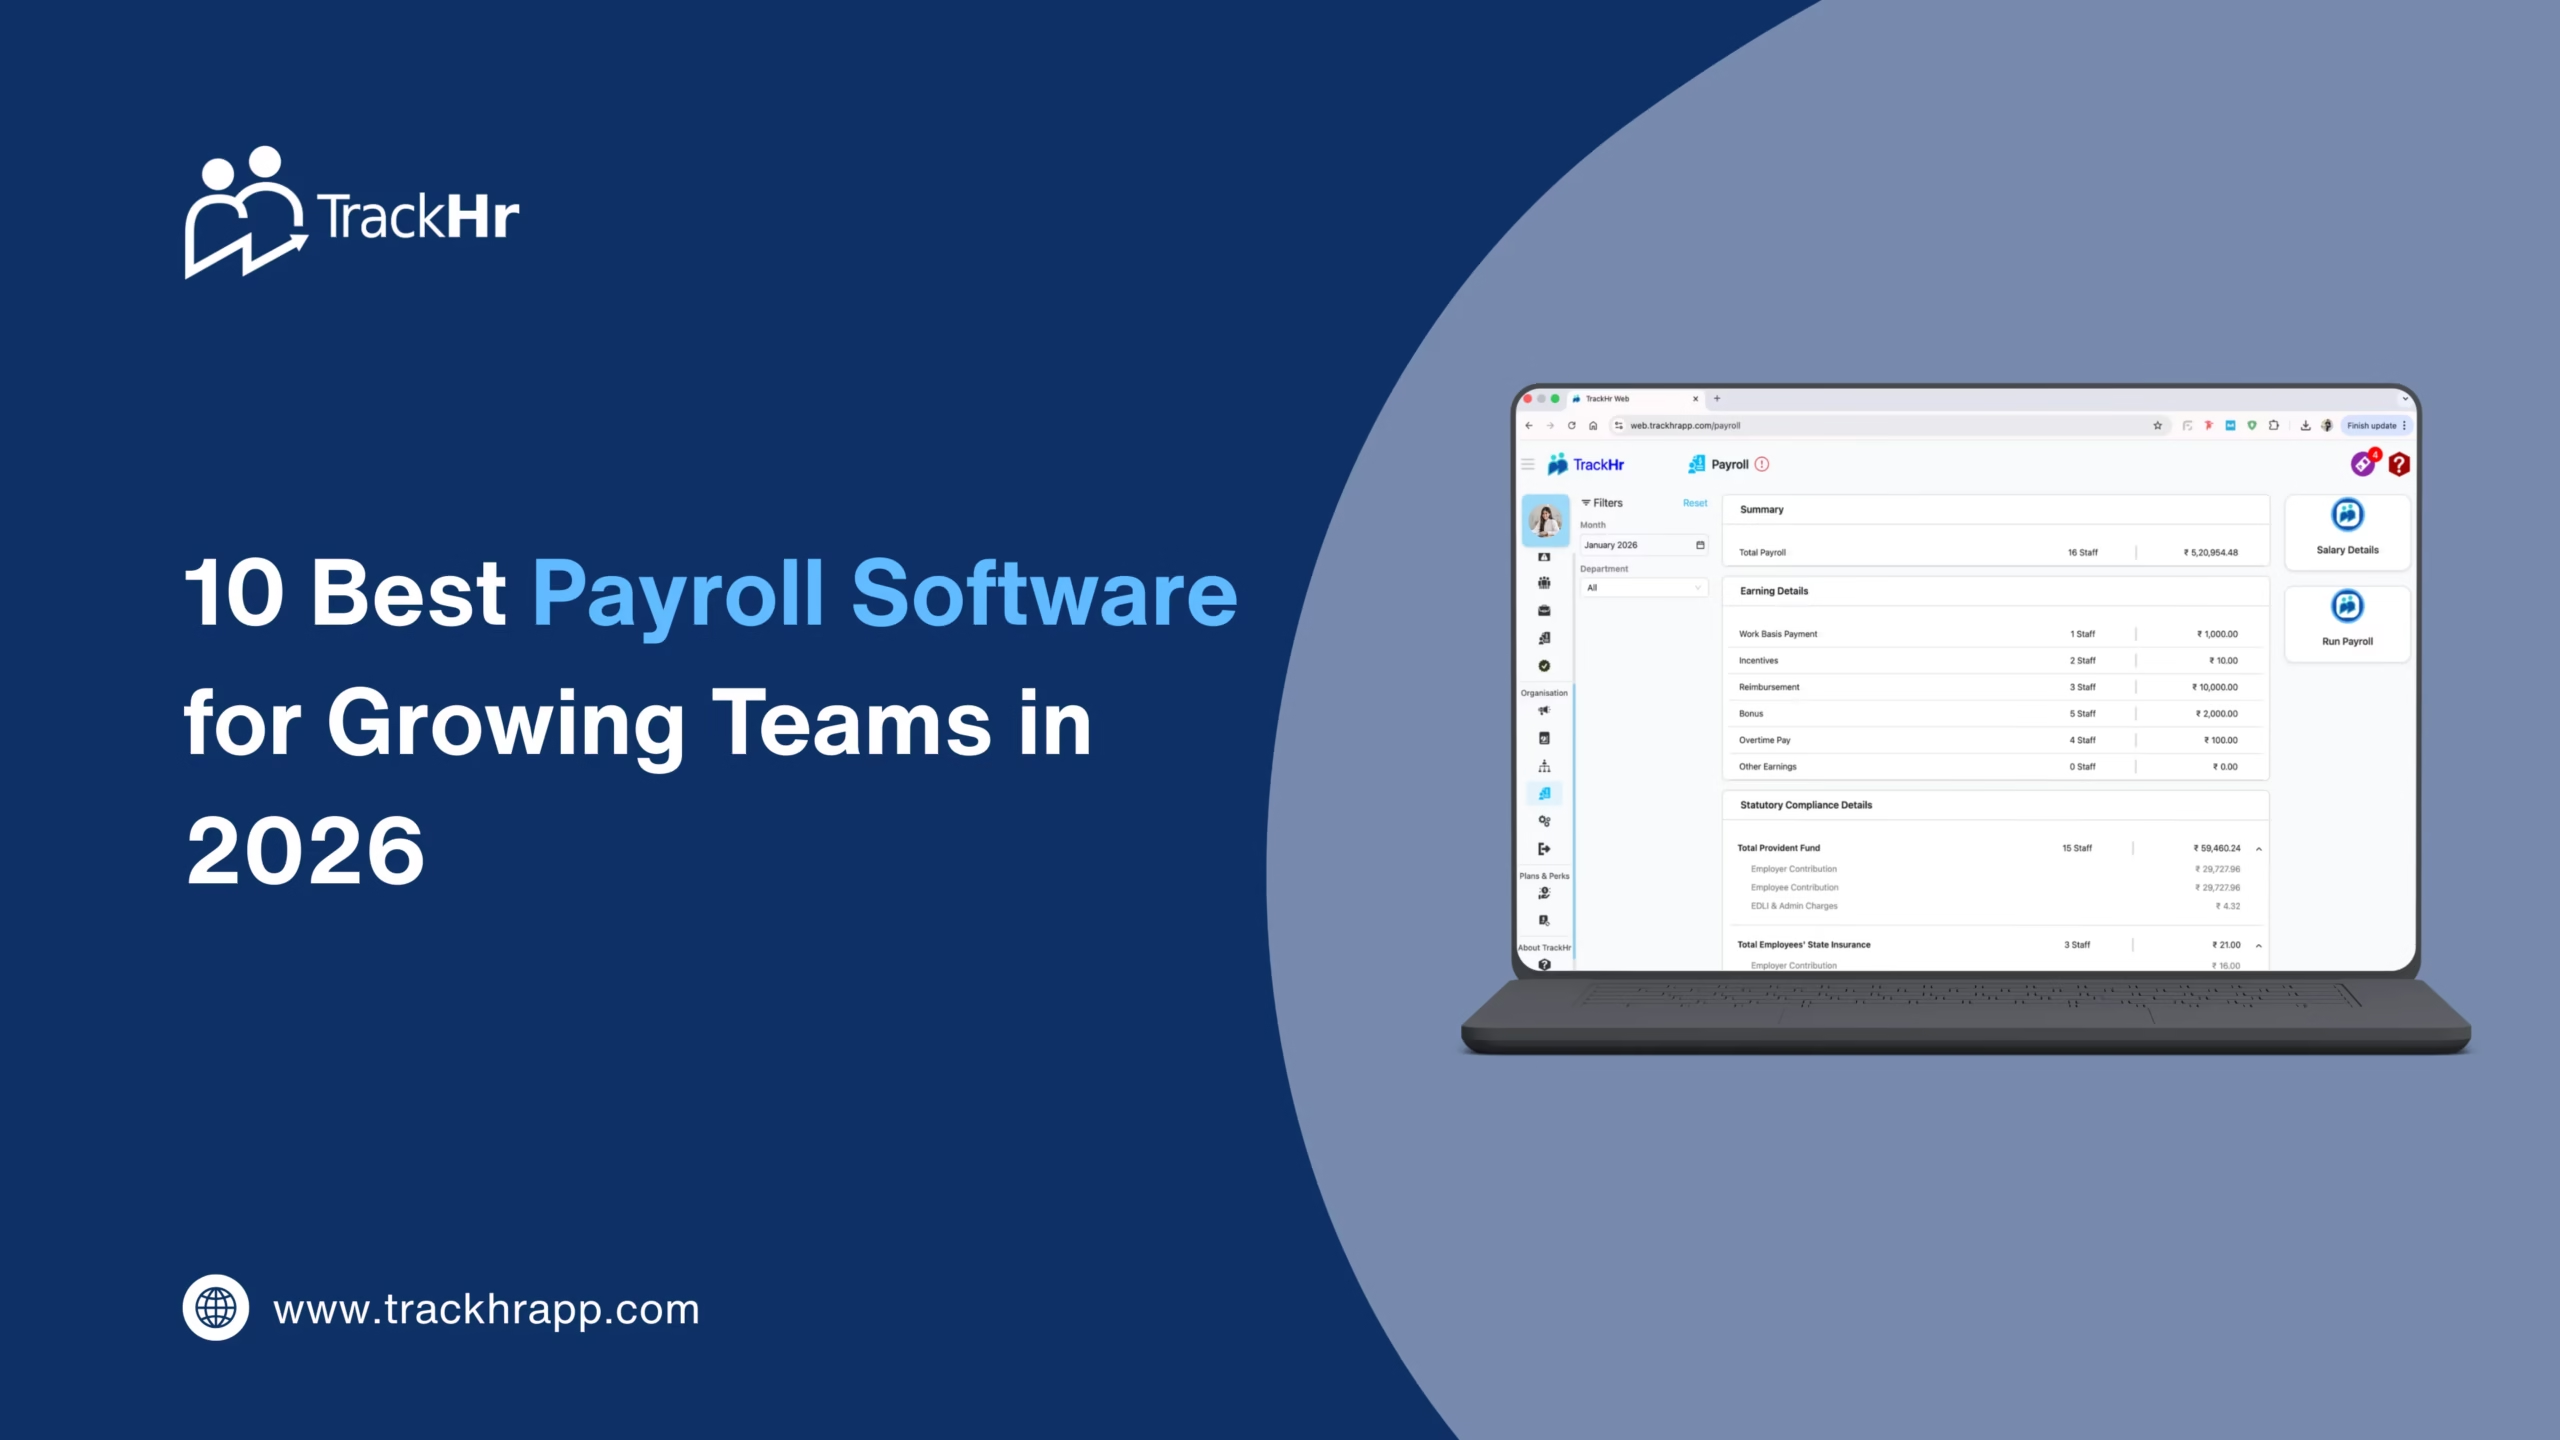
A performance dashboard is a data visualization tool that displays real-time metrics and KPIs to help organizations monitor performance against strategic goals. Dashboards consolidate data from multiple sources and present it in an easy-to-understand format, making it simpler to identify trends, spot issues, and evaluate performance.
Key Benefits of Using Performance Dashboards
1. Real-Time Monitoring
Dashboards offer live updates, allowing businesses to monitor key processes and respond immediately to performance deviations.
2. Improved Decision-Making
With centralized, visual data, decision-makers can draw insights quickly and confidently.
3. Enhanced Transparency
Stakeholders can clearly see progress toward goals, fostering accountability and alignment across departments.
4. Increased Efficiency
Automated data reporting saves time and minimizes manual work, letting teams focus on value-driven activities.
5. Customization
Dashboards can be tailored to display metrics relevant to specific departments, such as sales, HR, or operations.
Examples of KPIs to Track
Ensure your application meets regional data security standards:
Sales Metrics: Revenue, conversion rates, pipeline status
Marketing Metrics: Website traffic, lead generation, campaign ROI
Choose KPIs that align with your goals and provide actionable insights.
Step 3: Choose the Right Tool
Pick a platform that integrates with your existing data sources.
Step 4: Design the Dashboard
Use clean layouts and clear visualizations that highlight performance trends.
Step 5: Test and Optimize
Continuously refine the dashboard based on user feedback and evolving business needs.
Conclusion
Performance dashboards are no longer a luxury—they’re a necessity in the competitive world of modern business. By offering real-time insights, promoting transparency, and enabling data-backed decisions, dashboards play a vital role in strategic management and operational excellence.
Whether you’re a startup or a large enterprise, integrating a performance dashboard into your workflow can elevate your business’s ability to adapt, perform, and thrive.
Table of Contents
Exhausted from managing performance management manually?